Ahead of the governor's announcement on Minnesota's next steps in the response to COVID-19, the state department of health has released updated modeling projections about the virus' spread.
Minnesota Department of Health (MDH) Commissioner Jan Malcolm appeared in a live streamed presentation alongside State Health Economist Stefan Gildemeister at 11 a.m. Wednesday. They presented the latest version of the modeling that is used to help inform decisions by state leaders around the pandemic in Minnesota.
The modeling takes into account different scenarios with different lengths and degrees of social distancing and shelter-in-place restrictions, and then projects ranges of deaths and approximate "peak ICU demand" timelines. MDH has stressed that models are not used to predict exact numbers, but are tools to help them understand which variables are the most important in reducing deaths and delaying the peak of the virus in order to build up hospital capacity.
Gov. Tim Walz first revealed an earlier version of the modeling on April 10. MDH has been promising to release the data publicly once again after they re-run the model with updated information, including the effects of the Stay at Home order that's been in place since March 27.
The new version of the model incorporated five key changes, according to Gildemeister:
- Factored in asymptomatic infections and deaths occurring outside the hospital
- Restricted the ICU demand metric to only ventilated cases, since physicians say that’s what matters most
- Plugged in newly available U.S. data
- Incorporated new calibrated parameters like the proportion of 70+ year olds dying in non-hospital settings, and reduction in contacts under stay-at-home restrictions
- Included real-world Minnesota deaths and hospitalizations through April 25
In general, the new model shows less time to the peak of cases, and some increases in estimates for ICU demand and full-epidemic mortality.
"The general direction we're seeing here is that there's increased mortality by the end of May," Gildemeister said.
Gildemeister said several things factor into the changes:
- They re-calibrated to include rising Minnesota deaths
- Mitigation was less effective than expected, with both initial physical distancing (38% instead of the hoped-for 50%) and the stay at home order (59.5%, not 80%)
- Changes to ICU mortality assumptions and data

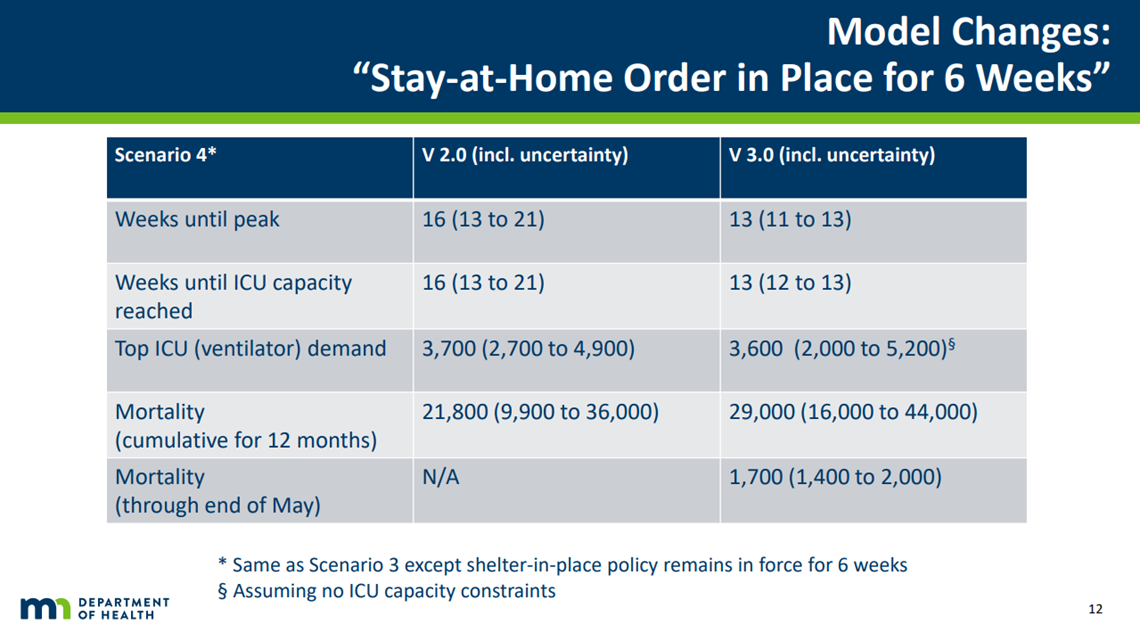
A side-by-side of the new and old versions of scenario 4 shows an earlier peak, and a higher mortality rate from those that were previously projected. That is the scenario in which the Stay at Home order would have been lifted on May 8.
The new modeling also offers mortality rates through May and for the full pandemic, clearing up some confusion about the disparity between the University of Minnesota model and other national models that only reach through the spring.
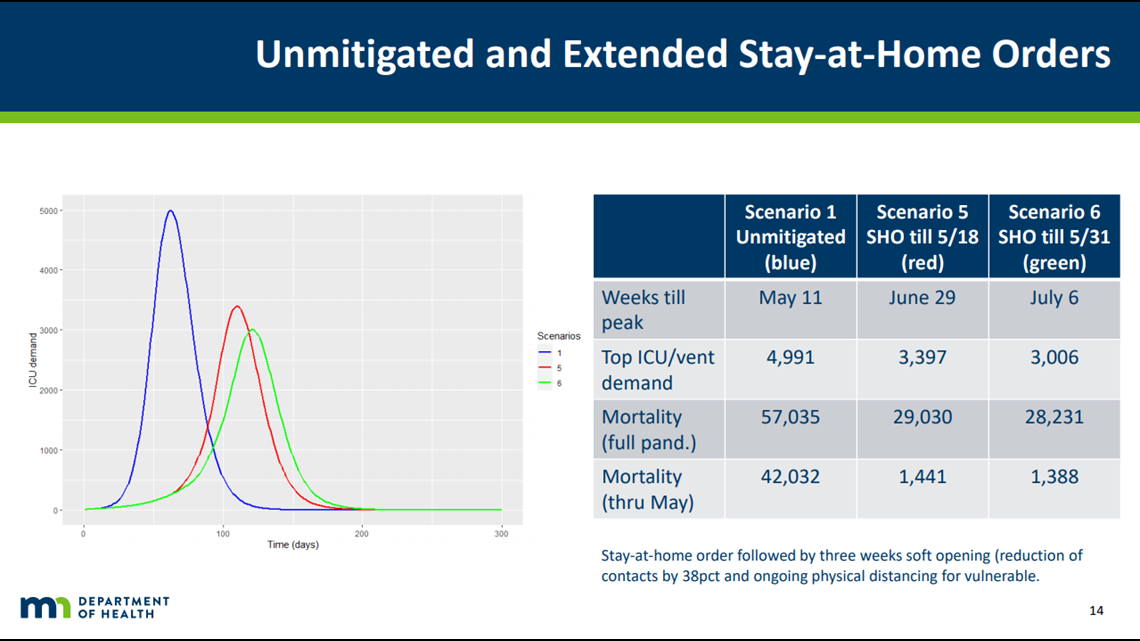
The updated model offers scenarios 5 and 6, which assume Stay-at-Home Orders until May 18 and May 31, respectively. Scenario 5 projects a peak on June 29, with a peak ICU demand of 3,397, and a mortality rate of 1,441 through May and 29,030 for the full pandemic.
Scenario 6 shows the peak occurring July 6 with 3,006 ventilators needed, and a mortality rate of 1,388 through May and 28,231 throughout the full pandemic.


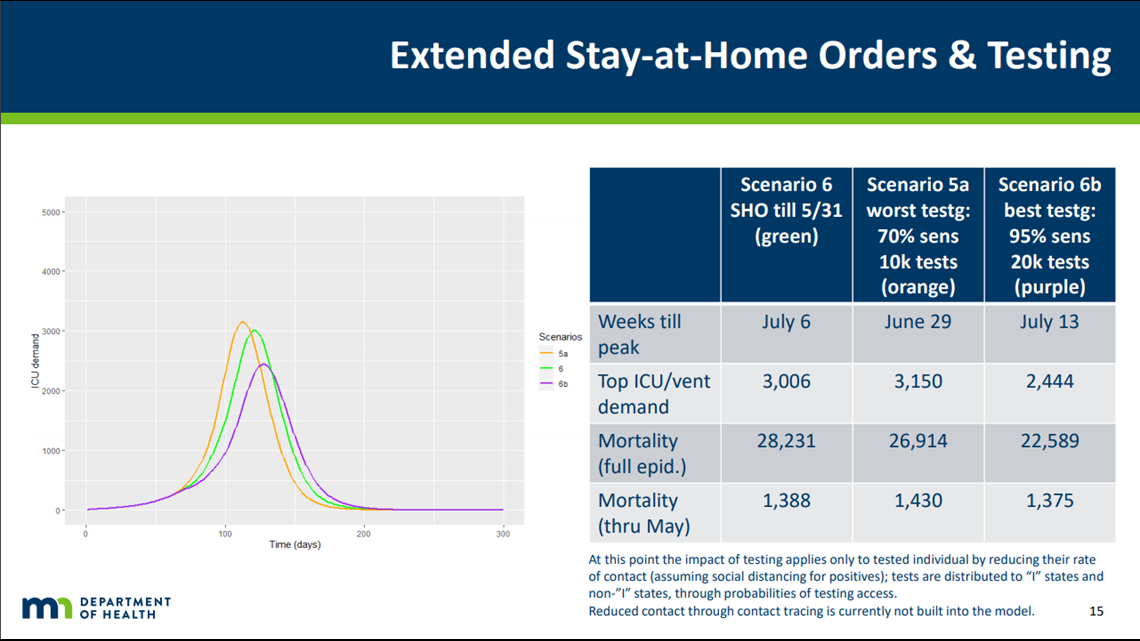
"The real pathway to significantly flattening the curve is long-term mitigation," Gildemeister said, though he clarified that his team is not necessarily recommending that.
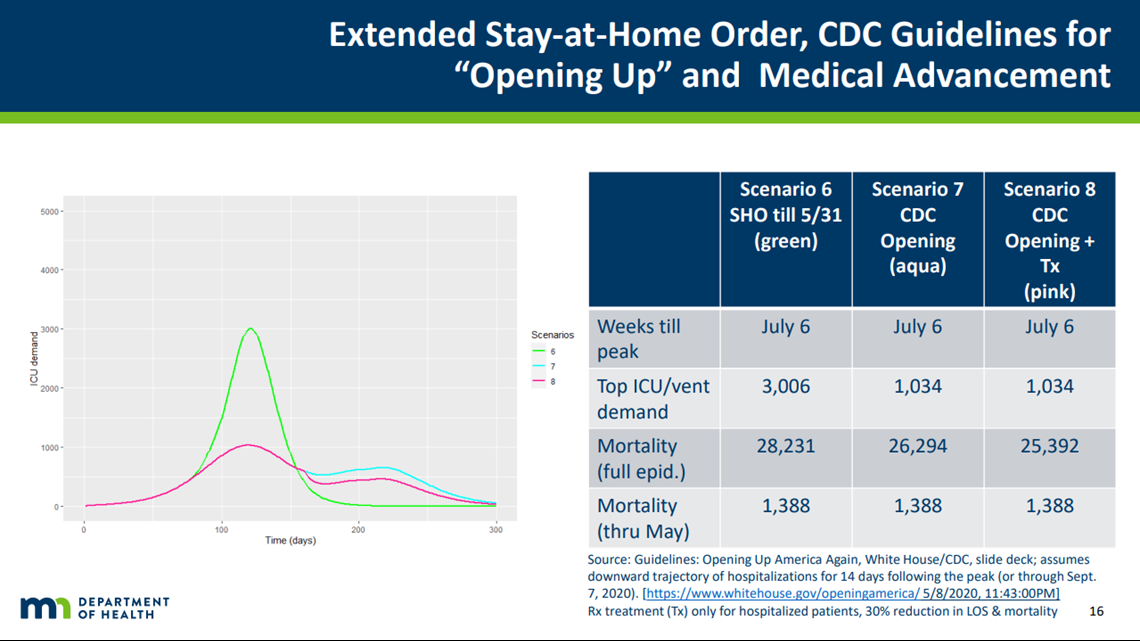
The only scenarios that appeared to dramatically reduce peak ICU demand were those that followed CDC guidelines advising states to wait to reopen until they have seen 14 days of declining hospitalizations following the peak. For Minnesota, that point is not projected until Sept. 7.
Gildemeister said pushing out the peak in itself does not lower mortality or ICU demand.
"The question is what are we doing with that extra time?" he asked. Gildemeister said that "just buying time without using it" will not necessarily have an impact on mortality.

Walz will give a live televised address later on Wednesday at 6 p.m., where he is expected to announce what happens next with the Stay at Home order, currently scheduled to expire on Monday. That address will be broadcast live on KARE 11, and streamed on KARE11.com, YouTube and Facebook.
KARE 11’s coverage of the coronavirus is rooted in Facts, not Fear. Visit kare11.com/coronavirus for comprehensive coverage, find out what you need to know about the Midwest specifically, learn more about the symptoms, and see what companies in Minnesota are hiring. Have a question? Text it to us at 763-797-7215. And get the latest coronavirus updates sent right to your inbox every morning. Subscribe to the KARE 11 Sunrise newsletter here. Help local families in need: www.kare11.com/give11.
The state of Minnesota has set up a hotline for general questions about coronavirus at 651-201-3920 or 1-800-657-3903, available 7 a.m. to 7 p.m. There is also a data portal online at mn.gov/covid19.

