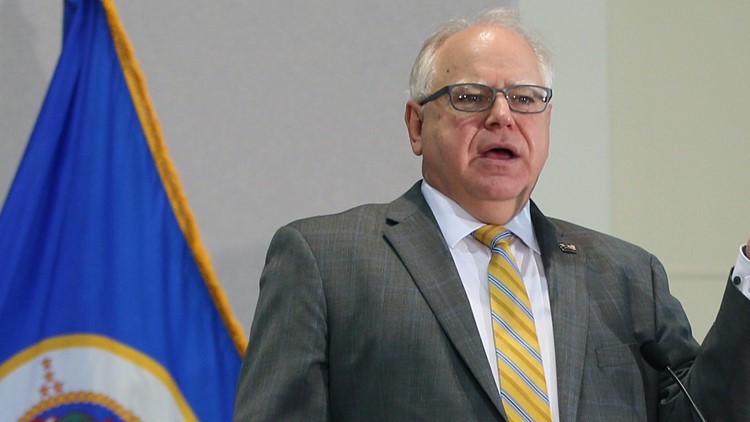
ST PAUL, Minn. — A new KARE 11/MPR News/Star Tribune Minnesota Poll finds that Gov. Tim Walz's approval rating is down by 8% since May, but is still relatively strong.
The poll, conducted by Mason-Dixon Polling & Strategy, Inc., surveyed Minnesotans who said they were likely to vote in November.
In the latest survey, done from Sept. 21-23, 57% of Minnesotans said they approve of Tim Walz's performance as governor. Thirty-six percent said they disapprove, and 7% are not sure.
The previous poll, conducted May 18-20, found a significantly higher 65% approval rating for the governor, who has received unprecedented exposure leading the state's response to the COVID-19 pandemic.
In the new results, the governor's approval rating is still strongest in the metro area, dropping by only 2% since May to 72% now in Hennepin and Ramsey Counties.
In southern Minnesota Walz's approval rating has actually gone up slightly, from 55% in May to 57% in September.
It's in much of the rest of the state that Walz has seen his approval rating slip, going from 65% to 48% in the metro suburbs and from 61% to 46% in northern Minnesota.
Walz has seen a 10% drop in his approval rating among Democrats, going from 93% in May to 83% in September. Twenty-seven percent of Republicans say they approve of the governor's job performance now, compared to 33% in May. And independents are still more likely than not to favor the governor with 59%, down from 65% in May.
Young people are the most likely to support Walz, with 68% of people ages 18-34 saying they approve of his performance. The group coming in second in support of the governor is people ages 65 and up, with 60% approval.
More than half of people ages 35-64 still approve of the governor's performance, as well.
The KARE 11/MPR News/Star Tribune Minnesota Poll was conducted by Mason-Dixon Polling and Strategy, surveying 800 registered Minnesota voters by phone (both landline and cell) from Sept. 21-23, 2020.
The poll has a margin of error of plus-or-minus 3.5 percentage points. That means there is a 95% probability that the "true" figure would fall within that range if every single voter were surveyed. The margin of error is higher for subgroups like age and gender.


